


The chosen Republican presidential candidate is consistently waging a war on immigration, claiming repeatedly that immigrants are stealing American jobs, and are the root of our social problems. By happenstance we took a hard look at population growth in this country about three years ago. While the numbers undoubtedly have changed with new census information, the broader long term trends are the same. The long and short of the data is that without immigration we would have a declining population, lower job growth, lower worker productivity (see WSJ article http://on.wsj.com/2aTfh4I), and a shrinking economy, nearly 70 percent of which is driven by consumer spending.
Take a look at the following graphs…
Exhibit 1: Birth Rate in the United States per 1000,000 population (1909-2009)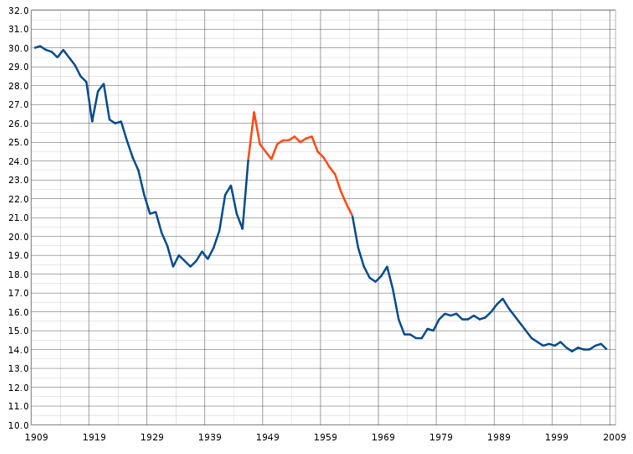
Everyone knows that the Millennial Generation, which started in the early 1980’s, is now larger than the Baby Boom (highlighted in red in Exhibit 1. So, if the net birth rate is the lowest it has been in 100 years where do all of the Millennials come from? Exhibit 2 shows where the growth has come from.
Exhibit 2: U.S. Population Growth 1950 to 2010 by Source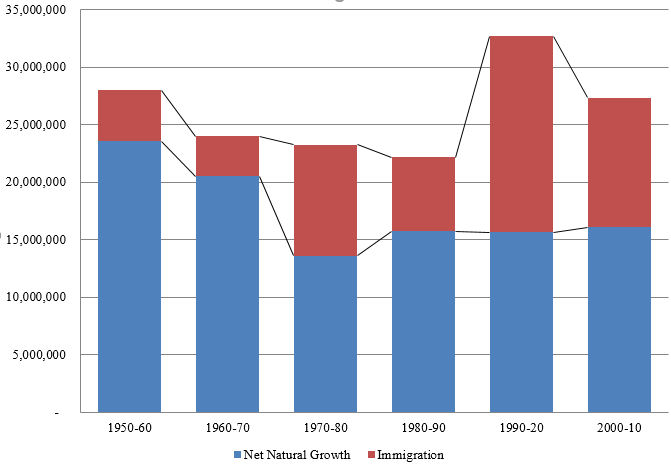
When you delve into the weeds of the data one discovers that approximately 80 percent of the population growth has come from new arrivals in the country, including their children.
And, the average age of an immigrant to this country has been 38 since 1990. So what does that mean for our job market? These are people that are in their prime working years. The following exhibit show the composition of our population by age group with and without immigrants.
Exhibit 3: Population Composition with and without immigrants (2010)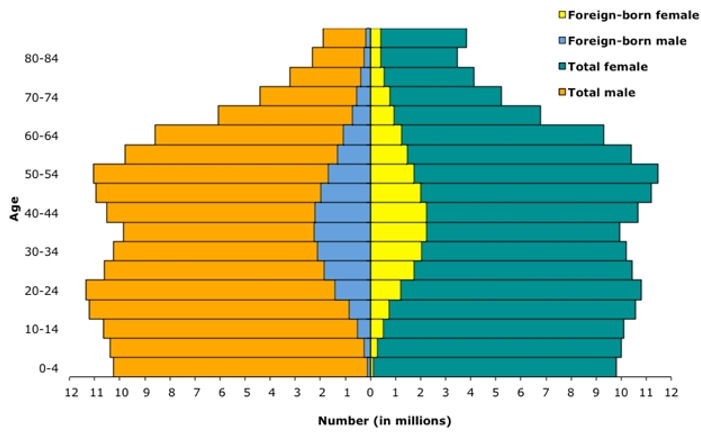
As may be seen, immigrants dramatically help to bolster the number of younger workers. Is is any wonder that our HN1B visa program is so popular and oversubscribed early in the year? Skilled talent in their prime working years is tough to come by.
Our presidential candidate is correct on one thing, however, and that is the source markets for our immigrants. Exhibit 4 shows that the distribution by geographic source has changed radically since 1960, with Latin America composing about 20+ percent of the total, followed by Asia with around 12 percent.
Exhibit 4: Source Markets for Immigrants to the U.S., 1960-2011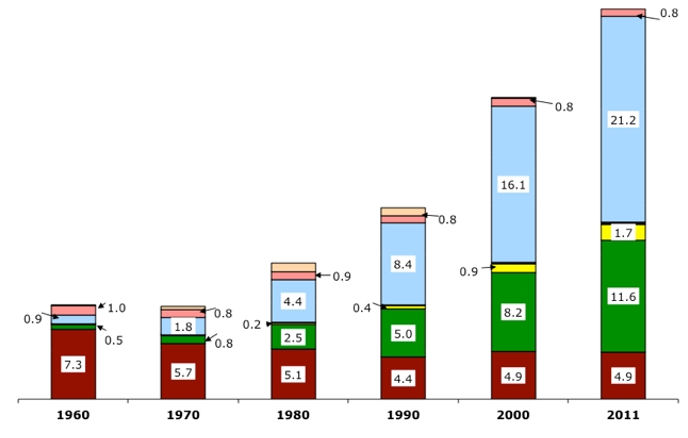
So, when our Republican presidential candidate was growing up the vast majority of immigrants looked like him. That is obviously no longer the case, but to assume that immigrants are some evil tide that needs to be quelled is unjust and fundamentally untrue. If one thinks of the turmoil that immigrants face in making the effort to get to the United States (or to Europe as is the present case), the physical and economic hardships, separation from family, friends, and culture, just for an opportunity for a better life, you have to admire their tenacity and grit. They don’t come to our shores looking for a handout, just for the chance for a better life and to send some hard earned money back home. Wait...didn’t all of our families do that? In 1791 when the Bill of Rights was adopted the United States had a population of less than 4 million living in 13 states. We didn’t get to where we are today without welcoming a lot of people to our shores.